There are two prevalent AWS logging and monitoring services: CloudTrail and CloudWatch. CloudWatch monitors AWS resources, while CloudTrail monitors actions in the AWS environment. Despite the considerable differences between them, integrating CloudWatch and CloudTrail allows us to better manage our AWS environments. For example, you can send notifications using the Amazon Simple Notification Service (SNS) whenever an authorization failure occurs in your AWS account.
This article will provide a deeper look into both CloudTrail and CloudWatch. We will also explore how these services can complement each other to provide finer control over your AWS infrastructure.
The table below provides a formal definition of AWS CloudWatch and AWS CloudTrail and describes their basic features. In-depth discussions of AWS CloudTrail and AWS CloudWatch and techniques for their use as an integrated service are provided later in this article.
| Parameters | AWS CloudWatch | AWS CloudTrail |
|---|---|---|
| Definition | CloudWatch is a monitoring service for AWS resources and applications. | CloudTrail is a web service that records API activity in your AWS account. |
| Monitoring Tool | CloudWatch monitors applications and infrastructure performance in the AWS environment. | CloudTrail monitors actions in the AWS environment. |
| Usage | With CloudWatch, we can:Collect and track metricsCollect and monitor log filesSet alarms and visualize | CloudTrail answers these questions:Who made a request?Which services were used?What actions were performed?What were the parameters for those actions?What were the response elements returned by the AWS service? |
| Logs or Event delivery Rate | CloudWatch delivers metrics data in 5-minute or 1-minute periods for essential monitoring and detailed monitoring, respectively.By default, log data will be sent by the CloudWatch Logs agent every five seconds. | CloudTrail delivers an event within 15 minutes of the API call. |
| Example | Suppose you have a web app running in your AWS environment; AWS CloudWatch can monitor bandwidth utilization, performance, and the traffic parameters of your app. | If your EC2 instance’s security is compromised by an attacker, you can identify the culprit with the help of historical CloudTrail data Logs. |
| Integration with Other Services | EC2 instances, autoscaling, load balancers, AWS SNS, SQS, AWS RDS, AWS S3, AWS DynamoDB, AWS CloudTrail, other AWS resources. | AWS CloudWatch, AWS ElasticSearch, AWS Lambda, third-party monitoring platforms, AWS SNS, AWS, SQS, etc. |
What Is AWS CloudWatch?
AWS CloudWatch is a monitoring service for the real-time monitoring of AWS resources and applications. It provides reports to analyze what is happening with your AWS resources. CloudWatch uses Metrics, Alarms, CloudWatch Logs, CloudWatch Events, and CloudWatch Dashboards to collect, access, correlate, and visualize data on a single platform from across your AWS resources and applications and services.
CloudWatch Metrics
Metrics are time-ordered sets of data points used for tracking the performance of AWS resources. You can also consider metrics as namespaces to represent and hold values of specific data points. For example, the CPUUtilization metric calculates the percentage of allocated EC2 compute units that are currently in use on the instance.

The above image shows the CPUUtilization of a sample AWS EC2 instance over time. AWS also gives us the flexibility to choose from default metrics, and we can make custom metrics as well.
CloudWatch Events and Targets
You can use the capabilities of CloudWatch Events to describe changes in AWS resources. It delivers a real-time stream of operational changes, such as the provisioning of RDS instances. Upon receiving event streams, CloudWatch Event responds by triggering actions such as sending messages. A Rule evaluates events based on preset thresholds and sends them to Targets for further processing. Targets can be of different types:
- Amazon EC2 instances
- AWS Lambda functions
- Kinesis streams
- Amazon SNS topics
- Amazon SQS queues
- Built-in targets
CloudWatch Logs
CloudWatch Logs empowers you to collect logs from AWS resources. You can treat CloudWatch Logs as a service that centralizes logs from all your AWS resources. The unified CloudWatch Agent can send logs to CloudWatch Logs; you can then query, sort, group, and visualize log data in dashboards. There are two crucial aspects of CloudWatch Logs:
- Log Streams: Sequences of events coming from the same AWS resource
- Log Groups: Groups of Log Streams that share the same monitoring settings
CloudWatch Alarms
Alarms, as the name suggests, invoke an action when a particular state is changed. The CloudWatch Alarms service continuously watches CloudWatch Metrics and alerts you whenever metrics fall outside preconfigured threshold levels. CloudWatch Alarms works on three properties:
- Threshold: Values to compare the metric value against
- Comparison Operator: Used to make comparisons
- Evaluation Period: The period over which the data is compared to the specified threshold
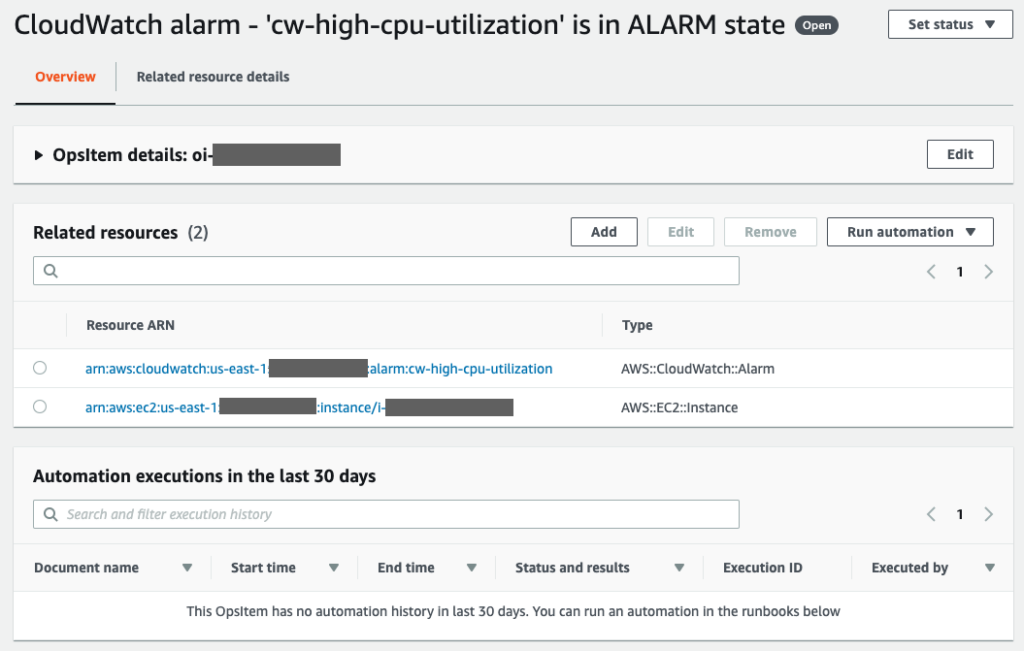
Alarms can show three statuses: OK, ALARM, and INSUFFICIENT DATA. The snapshot below shows that the OpsItem has the triggering alarm on an EC2 instance. You can click on the EC2 instance to investigate why EC2 is showing high CPU usage.
CloudWatch Insights
CloudWatch Insights provides a query language to search and analyze your log data in CloudWatch Logs. You can also produce time series visualizations using CloudWatch Logs Insights and view them in graphs over a dashboard. You can use CloudWatch Lambda Insights to diagnose issues with your Lambda functions and CloudWatch Container Insights to diagnose issues with your containerized applications and microservices.
CloudWatch Dashboards
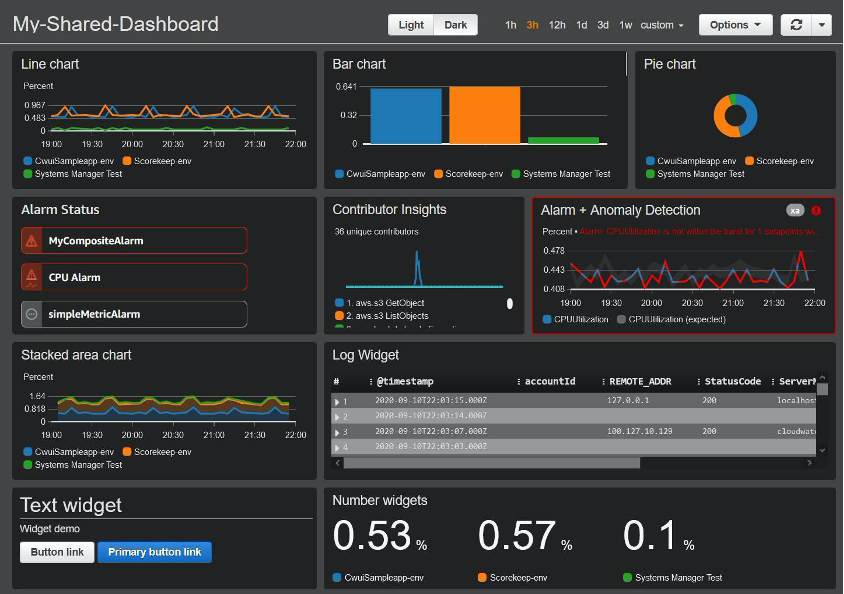
CloudWatch dashboards are pages to visualize the performance levels of AWS resources in a single view. You can create customized views of the metrics and alarms for AWS resources using CloudWatch dashboards. You can bring data to dashboards through CloudWatch Insight Queries or Metric Filters. Below is a sample dashboard that you can create with CloudWatch. It is a customizable dashboard that shows visualizations through charts, insights, and alarms. Visualization is based upon the data aggregated from different data streams.
What Is AWS CloudTrail?
Everything we do in the AWS environment, such as creating or terminating EC2 instances, creating subnets, etc., is done through an API call. AWS CloudTrail is a service that records AWS API calls for your AWS environment in the form of logs and saves those logs to S3 buckets. You can use AWS CloudTrail to see the following:
- The identity of the user (who deleted the instance)
- The start time of the AWS API call (when the instance got deleted)
- The source IP address
- The request parameters (e.g., instance ID)
- The response parameters returned by the service
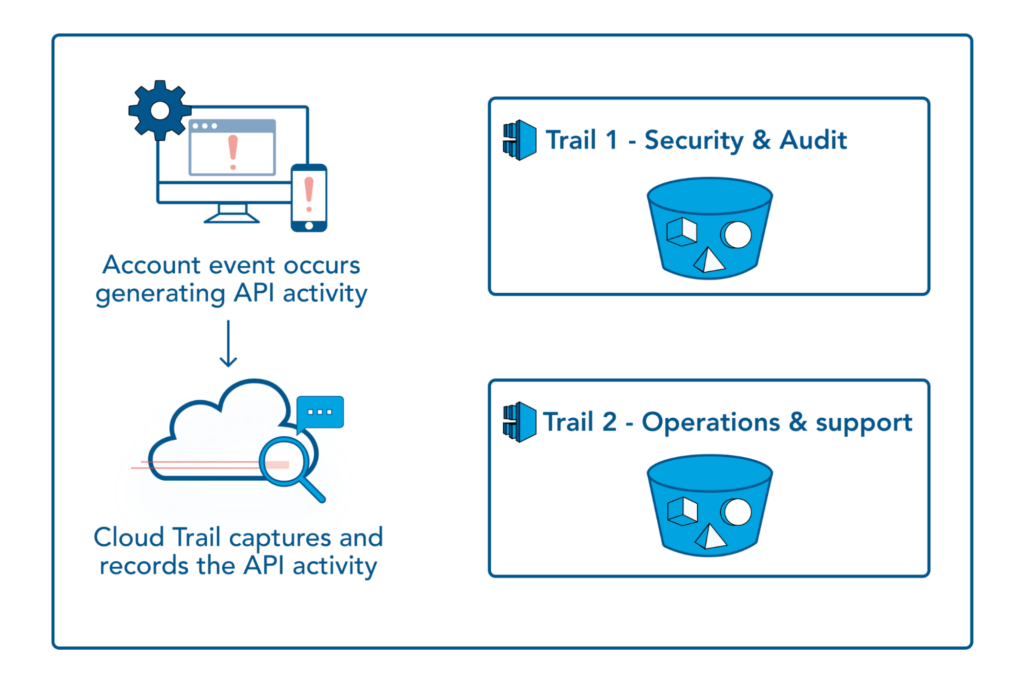
AWS CloudTrail is used for security purposes to monitor your AWS account and can respond with corrective measures when security vulnerabilities are recognized. Moreover, you can capture AWS management console activities to have more visibility into AWS users and resources through CloudTrail. You can also set up multiple trails in separate S3 buckets meant for different purposes.
Compliance is one of the best features of AWS CloudTrail. By integrating CloudTrail with CloudWatch Logs, you can investigate incidents and out-of-compliance events and cater to the needs of auditor requests in an IT setup.
It is a good practice to separate different CloudTrail log files meant for different purposes. In the image below, all the log files related to Security and Audit are kept in one bucket and Operations & Support, i.e., DevOps-related log files, are kept in another bucket. You can set up additional trails per your requirements in your AWS account.
Trails
A trail is a configuration that allows you to send CloudTrail Events to S3 buckets or CloudWatch Logs. After you create a trail, log files get delivered to the S3 bucket of your choice. Below is a sample trail that shows that the username John invoked the event StartInstances by using the ec2-start-instances command having an instance id i-ebeaf9e7.
{"Records": [{
    "eventVersion": "1.0",
    "userIdentity": {
        "type": "IAMUser",
        "principalId": "EX_PRINCIPAL_ID",
        "arn": "arn:aws:iam::123456789012:user/Alice",
        "accessKeyId": "EXAMPLE_KEY_ID",
        "accountId": "123456789012",
        "userName": "John"
    },
    "eventTime": "2014-03-06T21:22:54Z",
    "eventSource": "ec2.amazonaws.com",
    "eventName": "StartInstances",
    "awsRegion": "us-east-2",
    "sourceIPAddress": "205.252.233.176",
    "userAgent": "ec2-api-tools 1.6.12.2",
    "requestParameters": {"instancesSet": {"items": [{"instanceId": "i-ebeaf9e7"}]}},
    "responseElements": {"instancesSet": {"items": [{
        "instanceId": "i-ebeaf9e7",
        "currentState": {
            "code": 0,
            "name": "pending"
        },
        "previousState": {
            "code": 80,
            "name": "stopped"
        }
    }]}}
}]}
CloudTrail Events and Events Filters
CloudTrail Events are records of activities across your AWS account. CloudTrail Events are categorized into three types:
- Management Events
- Data Events
- Insight Events.
Management Events are events related to management operations such as configuring security, rules, etc. On the other hand, Data Events provide information on operations performed in or on AWS resources. Insight Events enable you to detect unusual activities in your AWS account.
You can also filter Events that are read-only, such as DescribeSecurityGroups, or write-only, such as TerminateInstances, against each event. This is a good practice and can save on cost as well.
More reading on how to optimize Cloudtrail costs:
CloudTrail Event History
CloudTrail Event History provides a history of the events that occurred in the past. Records per history are customizable to your needs.
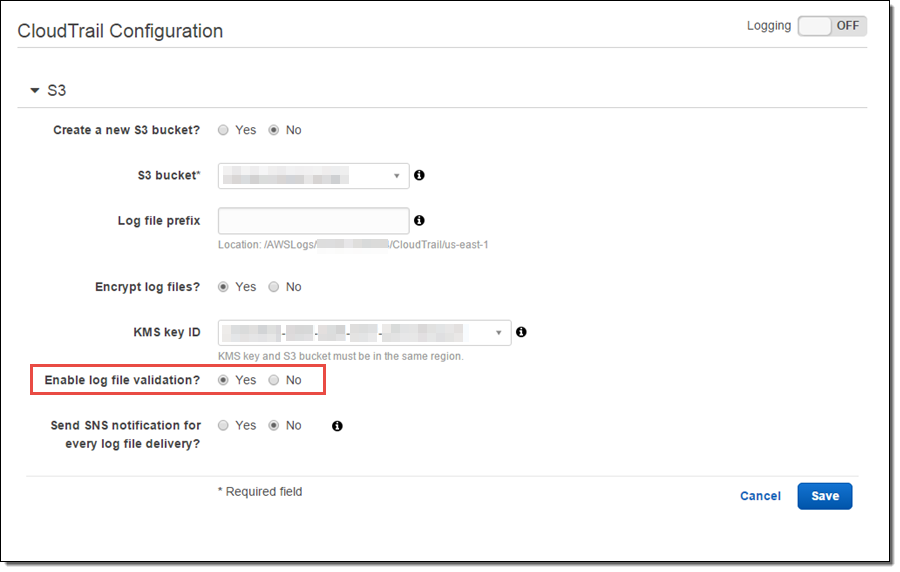
Log File Integrity Validation and Encryption Imagine that an IT audit is going on in your company, and you are asked to provide AWS Log files. How will you ensure that the Log files are genuine and nobody has tampered with them? CloudTrail has a file integrity validation feature to check whether Log files were modified or deleted after the CloudTrail agent delivered them to the S3 bucket. You can enable this feature during CloudTrail configuration setup as shown below:
More Reading:
CloudTrail Log File Integrity Validation
CloudTrail and CloudWatch Integration
Now that we have covered the basics of CloudWatch and CloudTrail, it is time to see how you can blend both services to generate SNS notifications from CloudWatch, which receives logs captured by CloudTrail from an S3 bucket.
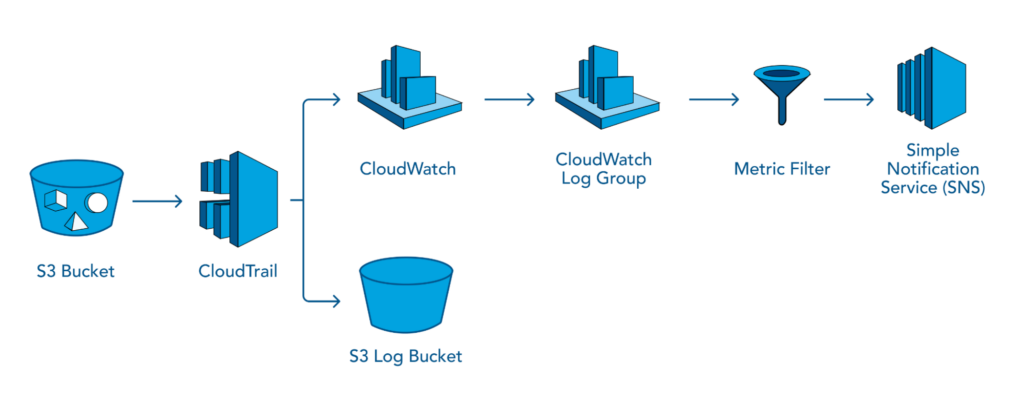
In the diagram above, we have configured CloudTrail to store data events of the S3 bucket to another S3 (Log) bucket. Hence, when a user adds a PDF file to an S3 bucket, log data specifying that a PDF file has been uploaded is generated. CloudWatch ingests that Log data using Metric Filter and CloudWatch Log Group.
We have also subscribed to an SNS topic to receive notifications (email or SMS service). Additionally, we have configured CloudWatch to visualize trends in the form of graphs on CloudWatch dashboards. If you want to implement the above architecture in your AWS environment, you can follow these steps:
1. Create a Trail for an S3 bucket to enable data event logging for objects in a bucket.
2. All the object-level API calls, such as GET, DELETE, PUT, POST, HEAD, etc., can be logged into an S3 bucket of your choice in JSON format. Below is an example of a JSON entry:
{
       "Records": [
       {
         "event Version": "1.03",
         "userIdentity": {

             "type": "IAMUser",
              "principalId": "111122223333",
              "arn": "arn:aws:iam: :111122223333:user/myUserName"
              "accountId": "111122223333",
              "accessKeyId": "AKIAIOSFODNN7 EXAMPLE",
            "userName": "myUserName"
              },

 "event Time": "2019-02-01T03:18:19Z",
 "event Source": "s3.amazonaws.com",
  "eventName": "ListBuckets",
 "awsRegion": "us-west-2",
 "sourceIPAddress": "127.0.0.1",
  "userAgent": "0",
   "request Parameters": {
      "host": [

         "s3.us-west-2.amazonaws.com"]
},

“responseElements": null,
 "additionalEventData": {
"SignatureVersion": "SigV2",
 "Authentication Method": "QueryString"
},

"requestID": "47B8E8D397DCE7A6",
 "eventID": "cdc4b7ed-e171-4cef-975a-ad829d4123e8",
 "eventType": "AwsApiCall",
"recipient AccountId": "111122223333"

}
3. Use documentation to Configure CloudTrail Log to CloudWatch Log Group.
4. Create an SNS topic to receive notifications in case an event occurs to monitor[1] and analyze CloudTrail Logs using CloudWatch, you can also integrate your CloudTrail logs to third-party software.
Summary
In this article, we have gone a level deeper into the various attributes of the famous AWS services CloudWatch and CloudTrail. You learned how AWS CloudWatch utilizes its features, such as Logs, Alarms, and Insights, to provide monitoring services within an AWS environment. You also learned the logging capability of AWS CloudTrail and the log file validation feature. Finally, we explored how AWS CloudWatch and AWS CloudTrail are used together to create a more meaningful service.
You like our article?
Follow our monthly hybrid cloud digest on LinkedIn to receive more free educational content like this.