Monitoring all your resources is a cumbersome task, whether they are on-premises, in the cloud, or implemented via a hybrid architecture through a centralized system. Fortunately, CloudWatch has made the task easier.
In this article, we will discuss one of the prominent features of CloudWatch: CloudWatch Insights. We will also discuss its benefits, drawbacks, important commands, and use cases.
What Is CloudWatch Insights?
CloudWatch Insights is an essential feature of CloudWatch. It enables us to collect and monitor all operational and performance data of the complete stack (applications, infrastructure, and services). We can collect all the operational and performance-related data of our resources in the form of logs and metrics. All the monitoring is done by setting alarms and through event data.
We can leverage the actionable insights received from Insights to optimize application performance and resource utilization. Historical analysis of different aspects of resources, such as CPU utilization, network data usage, and memory utilization, can also be performed using Insights.
Different CloudWatch Insights capabilities can be used to analyze infrastructure resources. For example, Container Insights are used to monitor and analyze containerized and microservices-based applications. Various CloudWatch features are described in the table below.
| Features | Description |
|---|---|
| CloudWatch Logs Insights | Enables users to collect and store logs for AWS services such as CloudTrail, Lambda, API Gateway, SNS, etc. Also provides quick queries and visualization of log data. |
| CloudWatch Container Insights | Enables users to collect and monitor logs for containerized applications and microservices. Also supports K8S and the Amazon Container Orchestration service. |
| CloudWatch Lambda Insights | Enables users to collect, aggregate, and monitor AWS Lambda logs. |
CloudWatch Insights Benefits
CloudWatch Insights offers many benefits to firms that use AWS as a cloud resource:
- It is a centralized tool to analyze logs and metrics from all combined AWS resources.
- It is a pay-as-you-go service, which means no billing for non-usage.
- All AWS features, such as auto-scaling resources, are integrated with CloudWatch Insights. You can scale the resources per your need and CloudWatch can monitor all of it without any need for customization.
- CloudWatch Insights makes the root-cause analysis of errors easier; this can be done without using any external applications.
- Operational changes in any AWS resource can be viewed in real time.
CloudWatch Insights Limitations
There are a couple of limitations of CloudWatch Insights to consider before deciding what is best for your organization:
- In an AWS environment, an organization typically operates with several autonomous accounts. Most likely, each AWS account has its own set of services running on its respective account. However, CloudWatch Logs Insights only operates against logs recorded in the current AWS account. You cannot directly query all the logs across different accounts—you have to enable cross-account functionality to set up sharing accounts.
More readings: Cross Account, Centralized Account.
- CloudWatch Container Insights supports Elastic Container Service (ECS) but does not support AWS batch jobs. Furthermore, there is no integration support for external metrics.
Top CloudWatch Insights Use Cases
Some of the top use cases leveraging the benefits of CloudWatch Insights include uses in the following situations:
- In conversational interfaces to gain additional insights about how customers interact, helping improve service and customer satisfaction.
- In validating extract, transform, and load (ETL) processes.
- In application monitoring, especially when the application is containerized. CloudWatch Container Insights collects data at every layer of the performance stack, such as metrics and logs.
- In scenarios where there is a need for a centralized service to store logs and then pull metrics from them.
CloudWatch Insights Functionality
Architecture of CloudWatch Insights
CloudWatch is typically a two-component service, consisting of Metrics and Logging components, which take care of different types of functionality:
- Metrics Service: Manages the performance and operational metrics of AWS resources.
- Logging Service: Captures, stores, and manages all the logs.
All the applications or resources within AWS can send their logs to the Logging Service of CloudWatch via the CloudWatch Agent installed on the AWS resources. They can also send the logs via CLI or through APIs.
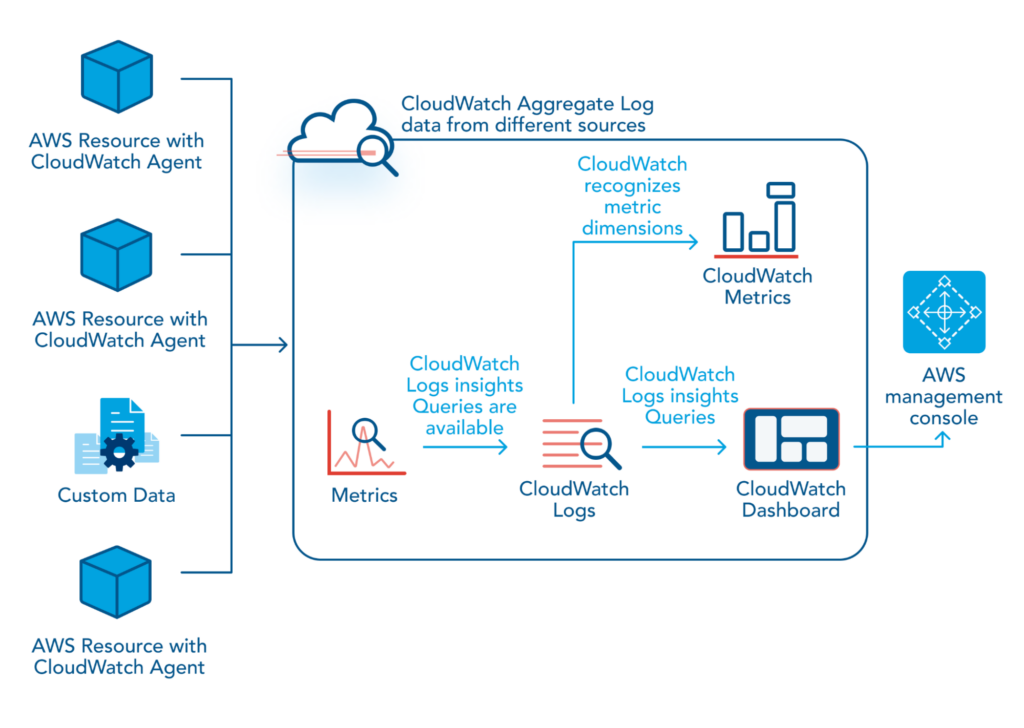
The log data is then ingested by the CloudWatch Logs as a timestamped message and stored as log groups or streams. Metrics are data points that typically provide information about performance rates. They are published by CloudWatch resources or by CloudWatch Log Insights. CloudWatch Log Insights then queries this data to generate time-series graphs. Filtering your log data further helps visualize log data and publish the results to CloudWatch Dashboards.
CloudWatch Logs Insights
CloudWatch Logs Insights is a service offered by AWS to search and analyze log data interactively. It enables users to query logs to help determine the potential causes of operational issues and resolve them. A single request can query up to 20 log groups.
Before running a CloudWatch Logs Insights query, you need to input the log data. AWS services such as CloudTrail, VPC, and RDS stream logs to CloudWatch Logs by configuring events, flow logs, and databases, respectively.
If you are interested in learning more about creating flow logs and events from CloudWatch, please review these pages: Flow logs, Cloudtrail events.
CloudWatch Insights Log Query Commands
We describe below the seven primary log query commands.
1. Display
This command defines the fields to display in a query. The following query uses the field @message and creates the ephemeral fields type and message. It filters the events to only those with SUCCESS as the value of Type but displays only the Message field of corresponding events in the results.
fields @message
	| parse @message "[*] *" as type, message
	| filter type = "SUCCESS"
	| display message
2. Fields
This command retrieves the specified field from log events. The example below creates an ephemeral field called Status that contains concatenated values from the retrieved fields Parameter and Threshold.
fields concat(Parameter, ';', Threshold) as Status3. Filter
This command filters the query per the conditions specified. For example, the query below finds the EC2 instances that were started in the region us-east-2.
filter (eventName="StartInstances") and region="us-east-2"4. Stats
This command calculates aggregate statistics per the log fields’ values. The query below will find the number of entries in a log for each event source and AWS region.
stats count(*) by eventSource, awsRegion5. Sort
This command sorts the log events in ascending or descending order.
6. Limit
This command permits restricting the number of values returned by the query. The query below uses the combined commands sort and limit to get 25 records, with the log names sorted in ascending order by timestamp.
fields @log,@timestamp
| sort @timestamp aesc
| limit 25
7. Parse
This command works with regular and glob expressions and allows extracting data from queried fields.
Querying Logs
To query log messages with CloudWatch Logs Insights, follow these steps.
- Sign in to the AWS console page with your credentials and open CloudWatch Logs Insights. You should now see the window below.
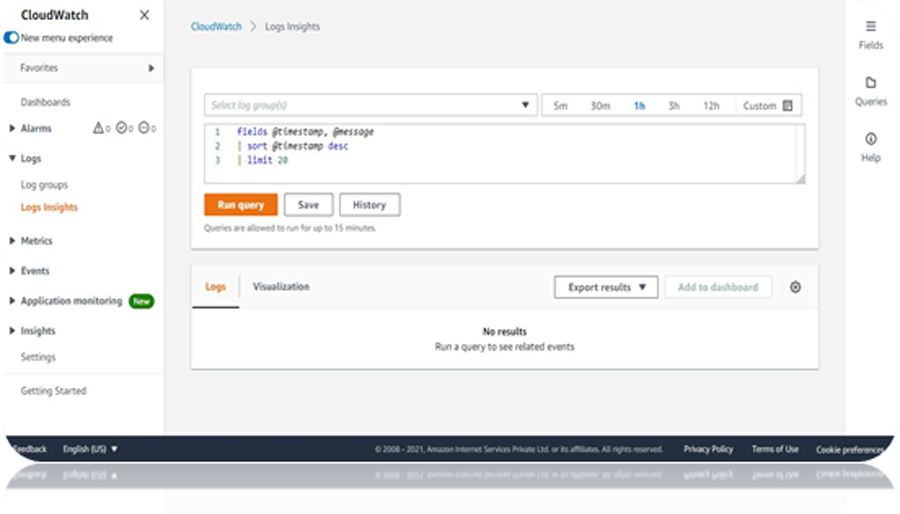
- Select a log group by searching for logs in the available search bar, or create a new log group. The service automatically detects the logs in the available search bar.
- Select a relative timestamp through the time selector in the upper right corner.
- Type the query you want to run, or select from the saved queries.
- Select the run query button.
- The results can be viewed in the console below or exported as a CSV file.
Viewing Recent Queries
View current and historical queries by opening the CloudWatch console, selecting Insights from the navigation pane, and then clicking the History tab. Viewing recent queries is extremely useful to save them for future reuse.
You can analyze log data after applying multiple queries over a period of time. For example, you can see a visualization of VPC flow logs from a chosen time. To do this, run the query below to see the log data along with the timestamps and messages of the last 20 events.
fields @timestamp, @message
	| sort @timestamp desc
	| limit 20
After running the query, the results would show something like this:
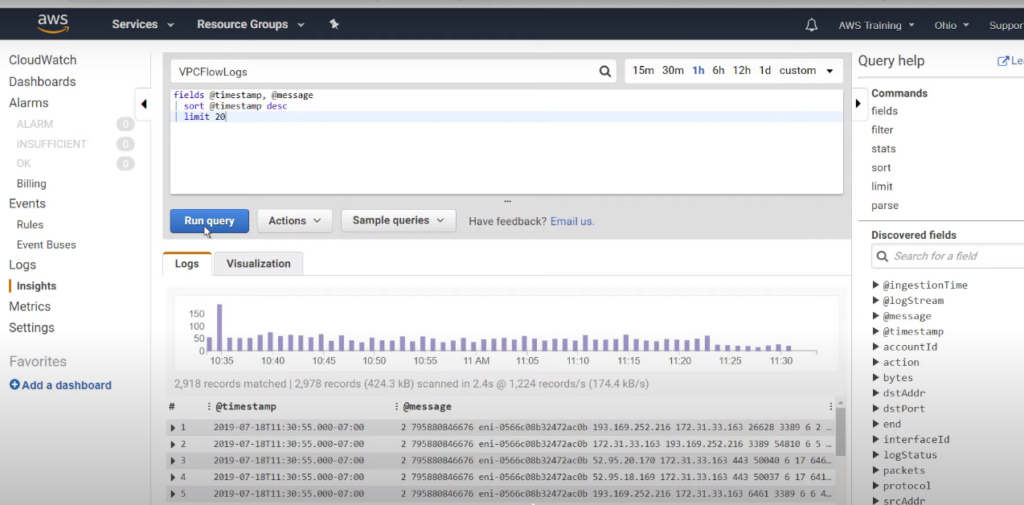
You can change the date period using absolute or relative time ranges. If you want to analyze specific data points in more detail, you can expand the data fields for a particular entry.
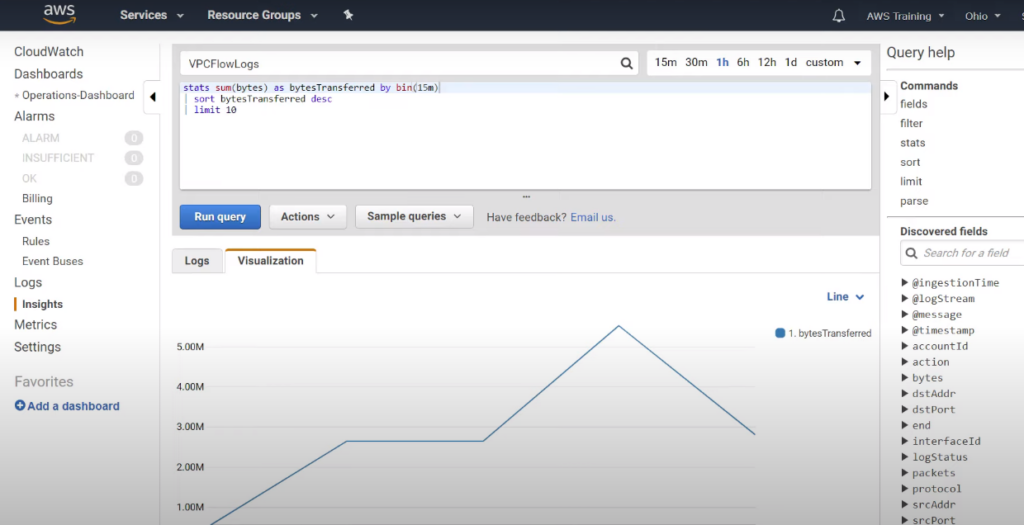
The Sample queries menu provides some basic queries that you might want to use for AWS services. For example, the sample query below shows which network interfaces in the VPC have transferred the most bytes.
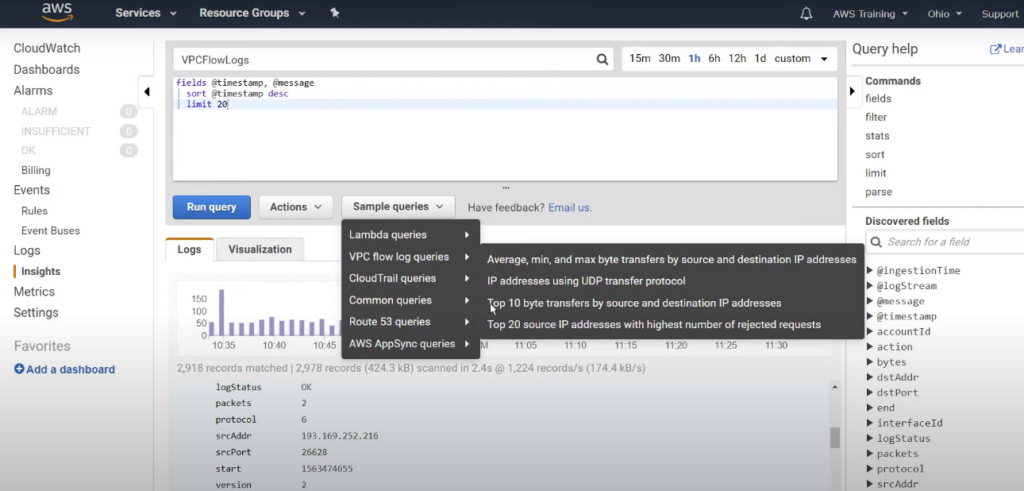
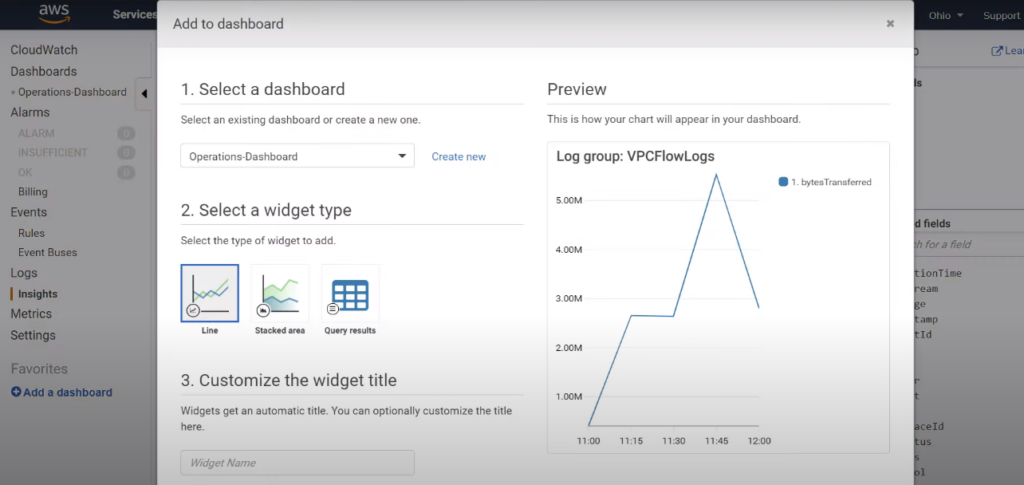
Under the Visualization tab, you can visualize your data. If you want to monitor your query in the future, you can add it in your dashboard from the tab Actions along with other metrics in one location.
Event Notification and Alarm Generation
In addition to having visualizations for your log data, AWS CloudWatch also enables its users to set different kinds of alarms: metric or composite. You can receive alarm notifications via SNS topic when your threshold value falls outside your defined value. You can also set multiple alarms to each metric and vice-versa.
You can read more about alarm generation in the official AWS documentation: Sending Email, CloudWatch alarms.
CloudWatch Container Insights
With the rise of containerization, it has become even more important to gain a better perspective on how each cluster’s applications and microservices are performing. CloudWatch Container Insights solves this problem by monitoring and troubleshooting ECS clusters. It collects, aggregates, and summarizes resource utilization in areas such as CPU, memory, networks, etc. We can use Container Insights with Elastic Container Service (ECS), Elastic Kubernetes Service (EKS), Kubernetes on EC2, and Fargate.
CloudWatch Containers Insights can be enabled via the AWS command line interface (CLI) by following these instructions.
For UNIX/LINUX/OSX servers, use the command update-cluster-settings. You need to specify a region against the region parameter and the ARN of your ECS cluster against the cluster parameter. In the setting parameter, the value must be set to enabled,as shown below.
aws ecs update-cluster-settings
  	--region <specify region name>
  	--cluster <Specify ARN of ECS Cluster>
  	--settings name=containerInsights,value=enabled
The above command will return the configuration metadata of the cluster as the output.
{
	"cluster": {
    	"status": "ACTIVE",
    	"statistics": [],
    	"tags": [],
    	"clusterName": "Name-of-the-Cluster",
    	"settings": [
        	{
            	"name": "containerInsights",
            	"value": "enabled"
        	}
    	],
    	"registeredContainerInstancesCount": <>,
    	"pendingTasksCount": <>,
    	"runningTasksCount": <>,
    	"activeServicesCount": <>,
    	"clusterArn": " Cluster ARN”"
	}
}
The same process needs to be followed for different clusters in the same region. If you need to change the AWS region, you can do so by again running the update-cluster-setting command with a different region.
CloudWatch Lambda Insights
Amazon CloudWatch Lambda Insights enables users to monitor and troubleshoot serverless applications on AWS Lambda. CloudWatch Lambda Insights collects multiple metrics from Lambda functions, including time series aggregated data in CloudWatch Metrics. Lambda Insights uses three types of metrics:
- Invocation Metrics: These are binary indicators of the outcome of an invocation. For example, error rate is calculated by dividing the number of errors by the total number of function invocations.
- Performance Metrics: Performance metrics provide performance details about a single execution of a Lambda function. For example, the Iterator age metric indicates the duration between the messages received at the stream and what is actually sent to the function.
- Concurrency Metrics: Lambda reports concurrency metrics as an aggregate count of the number of instances processing events across a function, version, alias, or AWS region.
You can check Lambda Insights for a single function or multiple functions. With a single-function Lambda Insights, you can delve and troubleshoot individual requests such as invocation errors, throttles, memory usage, network usage, CPU usage, etc. However, with a multi-function Lambda Insight, runtime metrics for the Lambda function in the current AWS account and region are aggregated.
CloudWatch Insights Best Practices
To get the most from CloudWatch Insights, we recommend following these best practices.
Write Structure Logs
You should always make a habit of writing structured logs (by using consistent, predetermined message formats to help convert strings of text into relational data sets). Querying structured logs is much simpler than plain text messages. While parsing logs, you will save yourself a lot of time writing regular expressions if the logs are structured.
Use Metric Filters to Organize Terms or Values in Log Events
Here are two examples of using metric filters:
- Counter: You can create a counter metric to monitor how many times a web server returns an HTTP or HTTPS error.
- Conditional statements in JSON: You can combine conditional statements into a compound expression.
Use Subscriptions for a Real-Time Feed
Have subscriptions delivered to other AWS services, such as Kinesis stream, Kinesis Data Firehose stream, or AWS Lambda, or have them loaded to other systems.
Specify a Custom timestamp_format Option
To make troubleshooting easier, you should always specify a custom timestamp_format option. If you don’t provide this, the time that the log was ingested into CloudWatch Logs is used rather than the time the event actually occurred. This makes it impossible to correlate incidents with the data in your logs.
Use Contributor Insights
Make use of Contributor Insights to analyze high-cardinality data, which identifies system behavior patterns by analyzing log events. You can find bad hosts, heavy network users, and more. By mentioning values for specific fields, you can also filter log entries.
Use Synthetic Logs
Use synthetic logs to evaluate the end-user experience. Synthetic logs let you replicate real-life interactions using Node.js scripts.
Sample Logs in Production
To keep track of the cost of logging, you should sample logs in production for a small percentage of transactions rather than logging at the debug level in production. This will save the time you would otherwise spend on CloudWatch Logs.
Integrated Monitoring Platform
Logs are only one component of an overall observability strategy. A complete monitoring platform must consolidate events and metrics from multiple public cloud providers and the private cloud resources residing in a data center. Events generated from logs such as CloudWatch Insights can be ingested by a centralized event management system for cross-correlation with events from other sources.
The other important ingredients of a successful monitoring strategy include analytics and automation. Analytical algorithms based on machine learning technology raises the accuracy of alerts. On the other hand, automation workflows eliminate some of the manual remedial tasks resulting in rapid time to resolution.
The OpsRamp platform is designed to consolidate tooling and enable integration by offering an open platform that delivers hybrid infrastructure discovery and monitoring, event and incident management, and remediation and automation.
Wrapping up
In this article we have covered the basics of CloudWatch Insights, focused on CloudWatch Logs Insights, CloudWatch Container Insights, and CloudWatch Lambda Insights. We have also discussed the strengths, limitations, and best practices to consider while using AWS CloudWatch Insights.
You like our article?
Follow our monthly hybrid cloud digest on LinkedIn to receive more free educational content like this.