AWS or Amazon Web Services is the most popular cloud provider widely used in the industry. AWS provides several cloud services like Storage, Computation, Machine Learning, RDBMS, etc., and all these services follow pay-as-you-go models equipped with serverless systems. This article will discuss one of AWS’s most popular and essential features, CloudWatch Metric Math.
AWS CloudWatch is a monitoring tool that collects the data from the utilization of the Instances like EMR, EC2, etc., in the form of logs and metrics and creates graphs from the data collected to visualize and monitor the job. You can create alerts, monitor the job, run machine learning models, and even automate the batch with the charts that it makes. Almost all of the AWS services export the utilization metrics. With the help of AWS CloudWatch, you can visualize the performance and utilization in the dashboard and define the next course of actions such as triggers, alarms, automation, etc.
CloudWatch is a great tool to visualize the metrics as-is, but if you want to go to the next level of metrics aggregation, triggers, alarms, etc., you can do it via CloudWatch Metric Math functions.
Introduction to CloudWatch Metric Math
AWS CloudWatch Metric Math is a feature of CloudWatch that allows users to combine multiple metrics from CloudWatch and create an integrated dashboard to monitor the resources and jobs and set the triggers and alarms to notify your operations team upon reaching the threshold.
To understand Metric Math, let’s take an example of AWS CloudWatch monitoring the CPU Usage and Memory utilization of AWS EMR instances. With the help of Metric Math, you can set the alarm when the combined Memory and CPU utilization reaches 90%. Once you set the alarm, it will notify the group about reaching the threshold.
Features & Use of Metric Math
Several AWS CloudWatch features are unique to Metric Math. Some principal examples include:
- Ability to set alarms based on various metrics such as resource utilization and job logs from multiple services, allowing you to monitor the cost of the services.
- Simplify the monitoring mechanism by adding Metric Math IF/AND/OR conditions to various metrics and triggering the alarm when reaching the threshold.
- Automatically increase/decrease an Auto Scaling Group’s desired capacity according to the load status from metrics.
- Combine various metrics and create calculated metrics for monitoring.

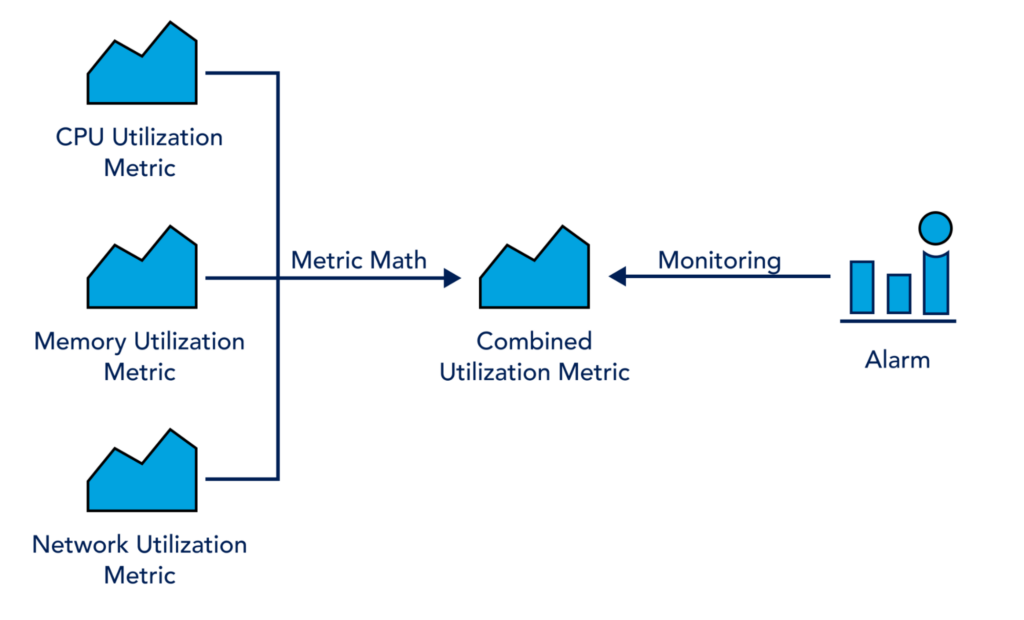
The above diagram shows how to combine the three different CloudWatch metrics visualizations–CPU Utilization, Memory Utilization, and Network Utilization–by using Metric Math and creating a combined Metric to set the triggers and alarms to notify users when anything goes above the threshold limit.
Operators and Functions of Metric Math
Metric Math has several functions and operators that assist users in combining and creating metrics. This section will explain the most common functions and operators from Metric Math.
Before discussing different operators and functions, here are some essential ground rules for using functions and operators:
- You have to write all the functions in uppercase letters (Eg – AVG, SUM, MIN, etc.)
- The Id field for all metric and math expressions must start with a lowercase letter.
- Data Type Abbreviation – In Metric Math, some functions are available only for a specific type of data; the following abbreviations are used:
- S represents a scalar number.
- TS represents time series.
- TS[] represents an array of time series.
Let’s discuss the Functions and operators in detail. The various operators available for Metric Math are as follows –
- Arithmetic Operator
- Comparison and Logical Operator
The METRICS() function
The METRICS() function returns all the metrics available in the request. For example, if you select CPU Utilization as the metric for an EC2 Instance, using the function SUM(METRICS()) will return the sum of CPU Utilization metrics over a specified time.
Basic arithmetic functions
The below table shows the available arithmetic functions supported by Metric Math. Any missing value equates to 0.
| Operators | Supported Data Type | Example |
|---|---|---|
| Arithmetic Operator + – / ^ | S, TS, TS[] | SUM(m1, m2), m1-m2 |
| Unary Subtraction – | S, TS, TS[] | -m1, 5*-m1 |
Comparison and logical operators
The Comparison and logical operators are used either with a pair of time series or scalar values. You cannot use the comparison operator or the logical operator between a time series and a scalar value.
The comparison operators upon comparison return 0 or 1.
The following table shows the available operators for Metric Math –
| Type of Operator | Supported Operator | Example |
|---|---|---|
| Comparison Operators | ==, !=, <=, >=, <, > | m1 = [10,20,30,0] , m2 = [20,,10,30] then, m1<m2 will return [0,1,1,0] The blank value will be considered as 0 by metric math. |
| Logical Operators | AND (&&), OR (||) |
There are many functions available for Metric Math. However, we are listing a few essential functions and will describe how to use them. Remember that all functions must be in uppercase letters.
You can find the complete list of available functions on the official AWS Metric Math page.
The final result from any math expression should be a time series or an array of time series. If any function produces a scalar result, you can combine it with another function to create a time series. For example, the AVG(m1) delivers a scalar value, and you have to use m1-AVG(m1) to result in a time-series format.
| Function | Description | Example |
|---|---|---|
| ABS | It returns the absolute value of any data points | ABS(m1-m2) |
| AVG | This function finds the average of time series | SUM([m1,m2])/AVG(m2) |
| DIFF | This function returns the difference between the value in the time series and the initial value from that time series. | DIFF(m1) |
| FIRST / LAST | This function returns the first and last value from a time series. | IF(FIRST(SORT(m1)) > 10, 1,0) |
| IF | This function, along with the comparison operator, returns true/false. | IF(FIRST(SORT(m1)) > 10, 1,0) |
| MAX | This function returns the max value from the time series. | MAX(m1) |
| MIN | This function returns the min value from the time series. | MIN(m1) |
| RUNNING_SUM | This function returns the running sum of the values from the time series | RUNNING_SUM([m1,m2]) |
| SUM | This function sums the time series values and returns a scalar value. | SUM(m1) |
Metric Math Expression
All the Metric Math functions and operators are available on the AWS console. Let’s see how you can add math expressions to the graph.
- Login to your AWS console.
- Search for CloudWatch in the services; this will navigate you to the CloudWatch page.
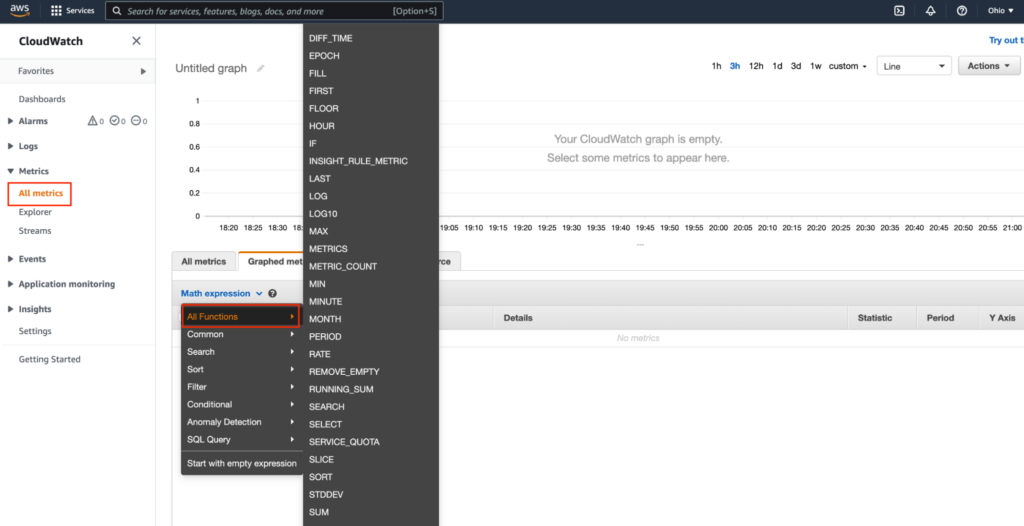
- Click on the Metrics from the left panel and select Add Math to see the list of available functions.

- Click on Add Math and select Start with a blank expression. A new line will appear with a blank expression.

- Type in any function name; the Intellisense feature on the Console will list the available functions for matching keywords. For example, if you type the letter ‘S’, it will list all the available functions starting from ‘S’ as shown in the below snapshot. You can then select the desired function.

- Add the sum function and update the Expression section with a meaningful name.

You must have at least one graph available from the AWS resource to view the metric
Example of CloudWatch Metric Math
Now that you have a basic understanding of creating Metric Math expressions, we will see what the aggregated CloudWatch logs look like, create alerts, and send notifications to users. This section will see the CPU Utilization metrics over EC2 instances. Login to the AWS console and search for CloudWatch service. Then, follow the steps below.
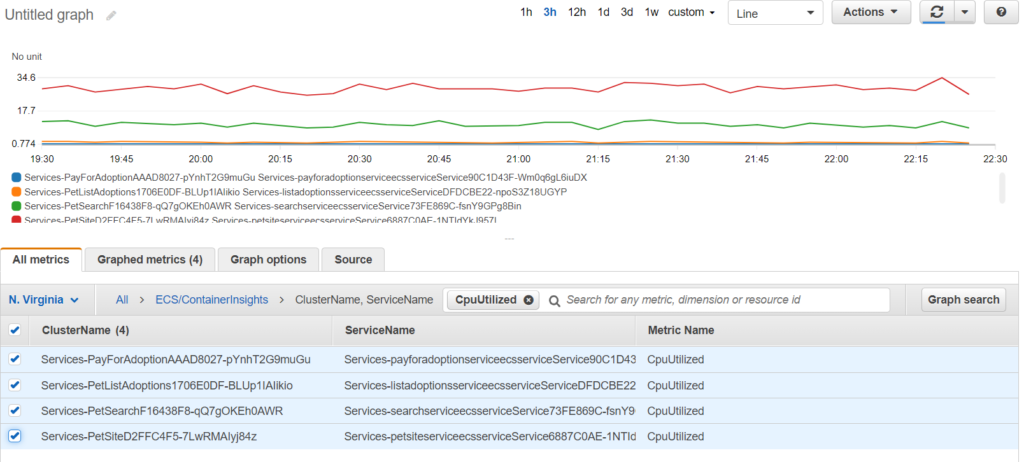
1. Apply the filters as shown below to see the graphs and metrics.

The above image shows the CPU utilization from four different containers. We will use Metric Math expression to club all four metrics and show them under a single graph.
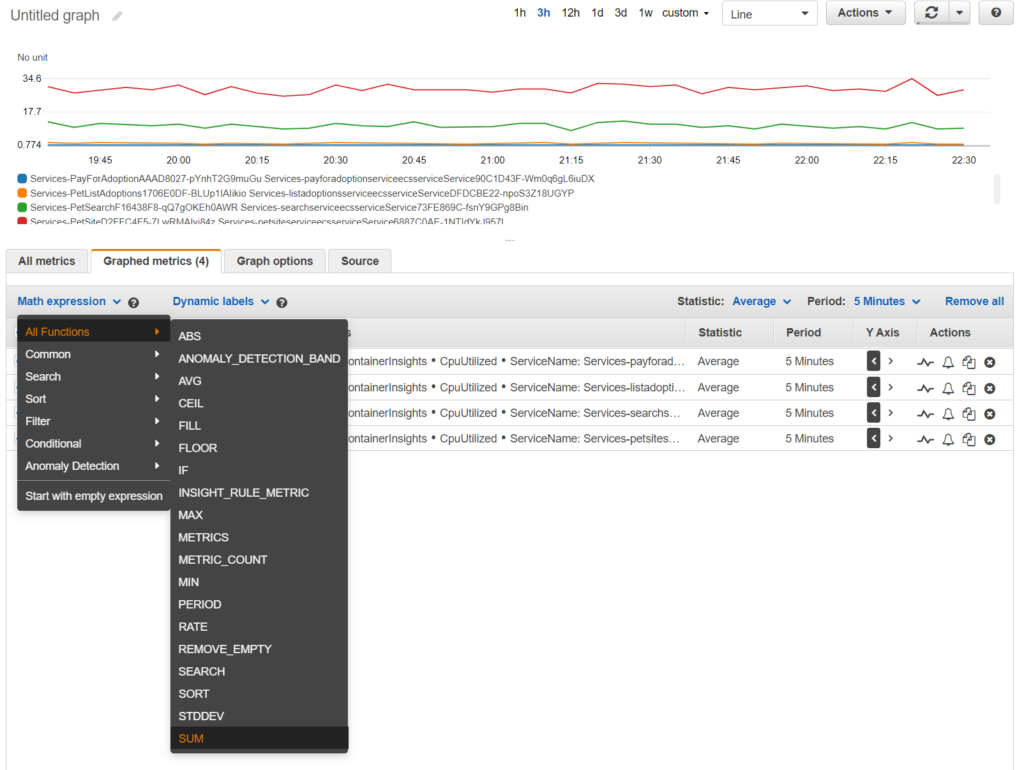
3. Click on Math Expression and select SUM as the math function.

4. In the SUM function, supply METRICS() as the argument. It will then aggregate all the metrics available on the graph.

5. The ‘Action’ section on the right-hand side of the expression allows you to create an alarm.
6. You can also create the custom ConnectionThroughputUtilizationPercent metric, by adding the formula like so: 100*(m2*m3+m4*m5)/m1
With the variables in the formula standing for the following values:
m1 = DatabaseConnections metric
m2 = ReadLatency
m3 = ReadIOPS
m4 = WriteLatency
m5 = WriteIOPS
Conclusion
In this article, we’ve demonstrated the usage of AWS CloudWatch Metric Math via simple examples that anyone can follow. Furthermore, we’ve aimed to provide clear explanations to get sysadmins started with the ideas and use cases behind Metric Math. This CloudWatch feature offers an excellent means for combining and monitoring a diverse array of metrics easily and in one place, making it the perfect tool to amplify productivity for anyone working with data.
You like our article?
Follow our monthly hybrid cloud digest on LinkedIn to receive more free educational content like this.