The open-source Prometheus monitoring tool offers a built-in dashboarding functionality even though it considers Grafana its visualization solution. Both Prometheus dashboard and Grafana allow users to query and graph time-series metrics stored in the Prometheus database, so deciding whether to use Grafana with Prometheus depends on your monitoring requirements.
This article will explore both of these open-source solutions and explain how they stack up against an alternative monitoring-as-a-service solution based on Prometheus technology.
Below is a tabular summary of the information presented in this article (in this table, OTB is an acronym for the expression “Out-of-The-Box”). A Monitoring as a Service solution based on the Prometheus technology is introduced later in this article.
| Prometheus | Grafana | Monitoring as a Service based on Prometheus Technology | |
|---|---|---|---|
| Visualization | Primitive support | Rich support | Advanced support |
| Alerting | Needs alertmanager | Basic support | Advanced capabilities |
| Offers single pane of glass view | No | Limited | OTB Single pane of glass view |
| Data Source Integrations | Via Exporters (mostly Linux ecosystem) | N/A | Advanced hybrid cloud support |
| Multi-Cluster Monitoring | No OTB support | N/A | Seamless multi-cluster monitoring |
| High Availability | No OTB support | N/A | HA and Fault-Tolerant |
What is Prometheus?
Prometheus is a systems monitoring and alerting toolkit that many consider being the standard for Kubernetes monitoring — and for a good reason. Prometheus has the ability to:
- Collect time-series data by pulling through exporters
- Store data as queryable metrics
- Specify an arbitrary list of labels for multi-dimensionality
- Automatically discover new resources it should collect from
- Easily build queries using time-series functions found in its native PromQL
- Generate and deliver threshold-based alerts through its Alertmanager
What is the Prometheus native visualization?
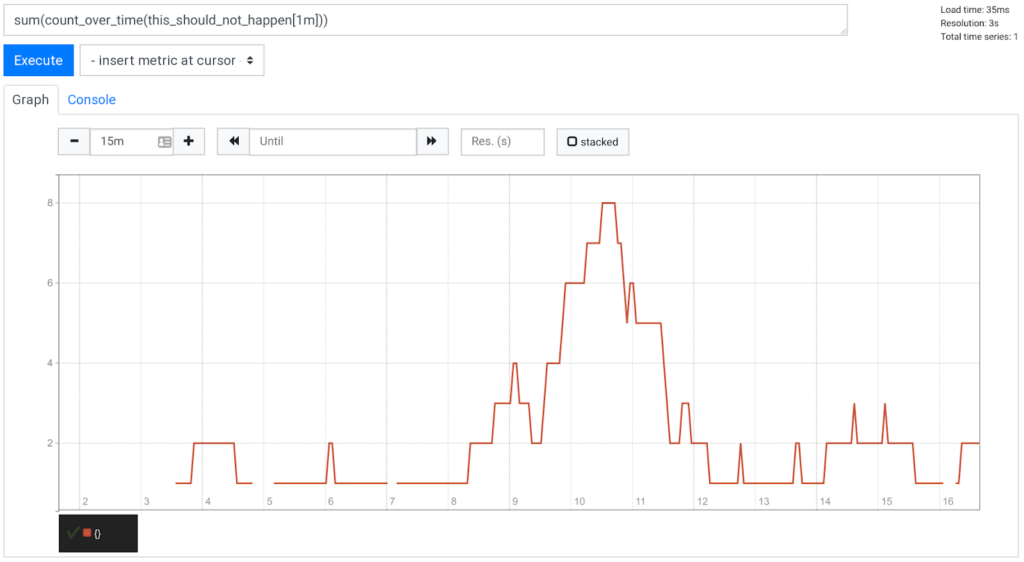
The Prometheus platform includes a simple capability known as the “expression browser” for visualizing metrics based on expressions constructed in PromQL. This functionality is available by pointing a browser to the /graph URL extension of the Prometheus server installation. The expression browser displays the expression query results in a tabular or graphical format for live troubleshooting.
Below is a sample result page of the expression browser.

The second functionality embedded in the Prometheus platform is known as the “console template”. This feature allows users to create a dashboard using the Go programming language. The configuration is flexible; however, it requires coding, and the learning curve is steep, especially for those less familiar with Go.
The Prometheus native visualization limitations
The main limitation of the expression browser are:
- Expression browser requires inputting queries to see results
- It is not intended as a dashboarding solution
- It doesn’t support drag-and-drop widgets
- It doesn’t support sharing
- It doesn’t integrate events and alerts into its visualization
- The console templates require programming in Go
These are the reasons why Prometheus recommends using the open-source tool Grafana as its visualization solution on its website.
What is Grafana?
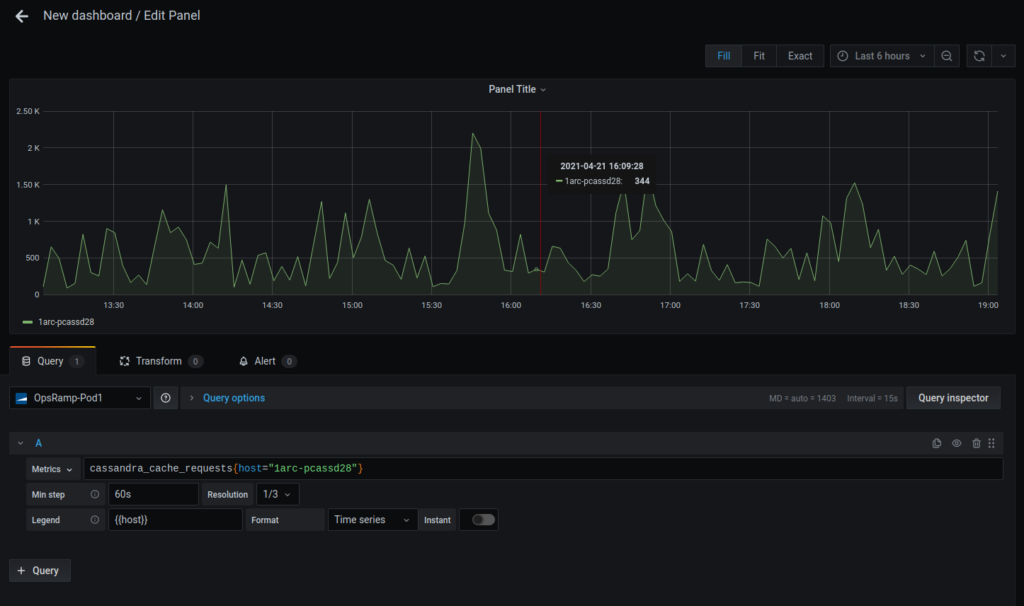
Grafana is a multi-platform analytics and visualization web application that acts as a single pane of glass for displaying all of your metric data — no matter where it lives. With Grafana, you can:
- Create charts, graphs, and maps
- Build and share dashboards
- Configure alerting rules that query one or more data sources
- Manage user access
Below is a sample Grafana dashboard.

Grafana Limitations
The only main noteworthy limitation of Grafana is that you must set up data storage and data collection separately. And because of this, Grafana has a limited ability to handle correlating across many data types.
See how OpsRamp enhances Prometheus in minutes with Prometheus Cortex
Prometheus & Grafana: Better Together
Based on their core functionalities alone, you might quickly realize that the two solutions are mostly complementary despite some overlap. Prometheus collects rich metrics and provides a powerful querying language; Grafana transforms metrics into meaningful visualizations. Both are compatible with many, if not most, data source types. In fact, it is very common for DevOps teams to run Grafana on top of Prometheus.
Prometheus Limitations
The Prometheus monitoring platform, separately from the Prometheus dashboard, has limitations that form an obstacle to scaling. These limitations justify considering a monitoring-as-a-service alternative based on Prometheus technology presented later in this article.
Lack of High Availability
Prometheus is not designed to operate in a high availability set-up. Running multiple replicas of Prometheus often leads to scraping duplicate metrics. Although there are workarounds, such as using Thanos alongside Prometheus for de-duping, such setups are configuration intensive.
Difficulty with Multi-cluster Monitoring
Because of Prometheus’s ability to auto-discover new data sources, using it for multi-cluster monitoring doesn’t work. Prometheus would simply scrape metrics from all available scrape endpoints — even the ones not provided. In most scenarios, these scrape endpoints reside within the same Kubernetes cluster, VPC, or Datacenter as the Prometheus server itself. But exposing scrape endpoints over the internet is a security risk.
To solve this problem, you would have to enable a single Prometheus instance to scrape metrics from other Prometheus instances stationed across your Kubernetes clusters in a method known as “stacking.” Stacking is not one of Prometheus’s core features. Previously, organizations used the Prometheus Federation solution to achieve this goal. The problem with this approach is that it leads to scraping only a subset of metrics from other Prometheus servers.
Alternatively, you can try Prometheus clustering with Thanos, as mentioned earlier. While this workaround scales fairly well, it is also configuration intensive — especially to meet all security requirements.
No Single Pane of Glass View
Prometheus has a rich community of exporters that can provide metrics from modern technologies such as Kubernetes and metrics from legacy cloud provider monitoring such as AWS Cloudwatch and Azure monitor. Prometheus does lack a single pane of glass view. To achieve that, we need to use tools such as Grafana to visualize those metrics.
Inflexible Alerting
We can create Prometheus rules to alert on certain metrics thresholds, but iterating over those rule configs is cumbersome and requires entirely reloading your configurations. The inability to configure alerts using the UI is another disadvantage of Prometheus.
Monitoring-as-a-Service Solutions
Although open source solutions are certainly cheaper to set up than paid solutions, it’s important to consider other factors as well. Choosing a long-term solution that is both highly available and scalable is critical for scaling. Getting open-source solutions to properly scale, while possible, comes with risk and a growing number of workarounds that you must maintain. What you save on service costs, you very well may pay in configuration hours or performance degradation. At this point, it is worth considering a paid Monitoring-as-a-Service (MaaS) solution.
Using a MaaS solution has a few significant advantages:
- Setup and maintenance is easier
- More first-class features for broader utility
- Vendor accountability when issues arise
- Ability to request feature enhancements
- Tool centralization
- Support and onboarding resources for your account
Monitoring as a Service based on Prometheus Technology
There are multiple Monitoring as a Service (MaaS) options in the market, but if you’re actively using Prometheus and Grafana, OpsRamp is the obvious choice for upgrading your monitoring stack for scale. Here are six reasons why:
1. Out-of-the-Box Prometheus Agent
Using its Prometheus agent, you can integrate your existing Prometheus setup and start shipping metrics to their Prometheus Cortex backend within 5 minutes. Simply:
- Deploy the tool’s Prometheus agent (for Kubernetes, it runs a daemonset).
- Configure a local Prometheus to remote-write to the agent.
Done!
2. Native Support for PromQL
A common barrier to switching to a scalable MaaS solution can often be porting custom integrations and learning a new query language. That isn’t the case here since the platform natively supports PromQL. All of the queries created for Prometheus will also run on your MaaS platform. This functionality is unique in the Monitoring as a Service market.
3. Support for High Availability
It solves Prometheus’ lack of high availability by ensuring that all of your metric data is securely stored in highly available data centers (essentially making your information immune to IT disasters). No strenuous Thanos workarounds are required.
4. Multi-cluster Support
As an organization starts to scale, infrastructure is spread across multiple data centers, Kubernetes clusters, or even Virtual Private Clouds (VPCs). Scraping Prometheus metrics from all of these varying infrastructures can be challenging to pull off securely.
With the tool’s dedicated Prometheus agent, this is not an issue. Simply install the agent across your infrastructure to securely ship the metric data to the Cortex backend (open-source, horizontally scalable, highly available, multi-tenant, long-term storage for Prometheus).
It’s also SOC and ISO certified, with ample measures in place to ensure your data’s security.
5. Compatible with Popular Data Sources
It seamlessly pulls data from sources, including those presented on the list below.
- AWS (it covers pretty much all of the 100+ AWS services)
- Google Cloud (similarly, it integrates with all services)
- Azure Monitor (once again, all services are supported)
- Open Source technologies (dozens such as HBase, Kafka, Cassandra, etc.)
- Compute (including Cisco UCS, Citrix XEN, Hyper-V, Nutanix)
- Network (such as Cradlepoint and Meraki)
- Storage (including EMC, Hitachi, NetApp, Pure)
- Custom (such as Webhooks or AWS EventBridge)
6. Visualization Features
It provides first-class dashboard visualization features, including many types of widgets and methods for aggregating and displaying metrics. The platform also supports integration with other visualization tools such as Grafana — meaning you don’t have to give up your favorite dashboard and analytics solution.
See how OpsRamp enhances Prometheus in minutes with Prometheus Cortex
Conclusion
Prometheus and Grafana specialize in solving different but complementary observability problems. It’s common to use Grafana as a visualization layer on top of Prometheus. While a simple Grafana-Prometheus set-up is quite easy to run, maintain, and afford, it won’t scale to match needs in large environments.
Considering a MaaS solution provides you with enterprise-grade availability that’s more secure than a fully open-source alternative, without having to ditch everything you’ve built and learned thus far. With OpsRamp, you can keep using your local Prometheus instance, continue writing PromQL queries, and still visualize all of your data using Grafana.
You like our article?
You like our article?
Follow our monthly hybrid cloud digest on LinkedIn to receive more free educational content like this.
Powered By Prometheus Cortex
Learn MoreNative support for PromQL across dozens of integrations
Automated event correlation powered by machine learning
Visual workflow builder for automated problem resolution
